
Campaign details page
The campaign detail page shows all the available details for the selected campaign. This page is divided into multiple tabs:
-
Overview — Provides a summary and graphical blueprint of the campaign.
-
Hosts — Provides a listing of the hosts affected by the campaign.
-
Timeline — Displays the events included in the campaign in chronological order.
-
History — Provides a textual history of the campaign.
-
Incidents — Provides a listing of the incidents that make up the campaign.
-
Mail — Displays the details of any malicious mail attachments that were included in the campaign.
Across the top of the campaign detail page is the data from the selected campaign card. It displays the calculated threat score, the campaign name (Campaign ID), the latest attack stage, the number of affected hosts, the number of different threats, and the status and assignee of the campaign. Click the button to return to the campaign page.
Campaign overview tab
The campaign Overview tab displays a summary of the campaign and an interactive graphical blueprint. There are two sections to this tab:
Campaign threats and hosts
The Threats and hosts section displays the Threats and Hosts widgets.
Threats widget
The Threats widget displays the current threats detected in the selected campaign. The severity of the threat is indicated by the color code: red for high, yellow for medium, and blue for low. Click the to view detailed information about the campaign on the Campaign timeline tab.
Hosts widget
The Hosts widget displays the hosts that are affected by the selected campaign. The severity of the threat is indicated by the color code: red for high, yellow for medium, and blue for low. Click the to view detailed information about the hosts on the Hosts tab.
Campaign attack stages
The Attack stages widget displays the attack stages, highlighting the current campaign attack stage(s). Hover over a highlighted activity to view a pop-up with more information about the stage.
Campaign blueprint
The Campaign blueprint provides an interactive graphical representation of the campaign. It displays the hosts involved in the campaign (both internal and external to your network), the threats that affected them, and additional information that complete the campaign description.
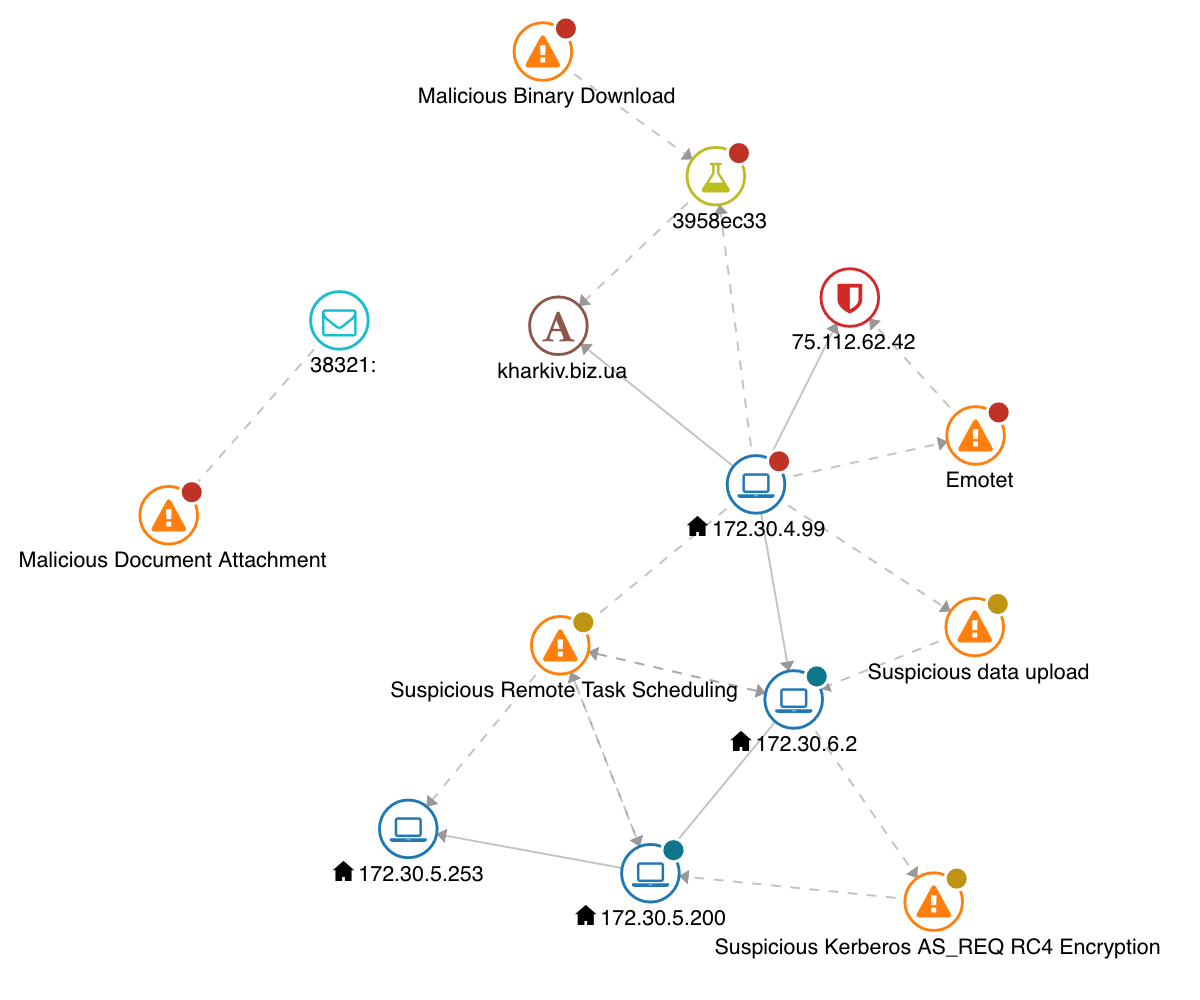
This example blueprint graph shows the following activities:
-
A malicious document node is attached to a email message node with label 38321.
-
This triggers a malicious binary download to the host node with label 172.30.4.99. This activity is consistent with a user on that host opening the email 38321 (for example, visiting a URL or opening an attachment contained in that email)
-
The host node with label 172.30.4.99 is connected to the hostname node with label kharkiv.biz.ua. The analysis report 3958ec33 shows that a download was made from the URL http://kharkiv.biz.ua/hPpD/. The analysis report also shows that what is downloaded is a PE executable application, 32-bit, Intel i386 file.
-
The host node with label 172.30.4.99 is connected to an Emotet command and control. The server is the blocked entry 75.112.62.42.
-
The host node with label 172.30.4.99 is connected to host node with label 172.30.6.2 with a suspicious data upload and to host nodes with labels 172.30.5.200 and 172.30.5.200 with a suspicious remote task scheduling, all activities associated with lateral movement.
-
The host node with label 172.30.6.2 is connected to the host node with label 172.30.5.200 with a suspicious kerberos encryption, an activity consistent with data exfiltration.
Node key
The following node types can appear in the blueprint graph:
Icon |
Node type |
Description |
|---|---|---|
|
Analysis report |
This node type represents the results of detonating a sample (file or URL) in the VMware NSX Network Detection and Response sandbox.
|
|
|
Blocked entry |
This node type represents a blocked entry (domain name or IP address).
|
|
|
Downloaded file |
This node type represents a file that was downloaded in the network.
|
|
|
Email address |
This node type represents an email address (a sender or recipient of email messages).
|
|
|
Email message |
This node type represents an email message.
|
|
|
Host |
This node type represents a network device.
|
|
|
Hostname |
This node type represents a domain name that was resolved in the network.
|
|
|
HTTP request |
This node type represents a HTTP request.
|
|
|
Info |
This node type represents a detection of an info-level activity. This node only appears in the Network analysis blueprint graph.
|
|
|
Threat |
This node type represents a detection.
|
About edges
The lines that connect the nodes are called edges.
A host node is connected to threat or analysis report nodes with a dotted line to indicate that the host corresponding to the host node was exposed to the threat represented by the threat or analysis report node.
Other connections are represented with a solid line to express that some activity (for example, a network connection, a DNS look-up, a web request) put the entities corresponding to two nodes in relation.
Blueprint interaction
The blueprint graph is interactive: supporting item selection, moving nodes, and zooming in and out.
Node and edges can be selected by clicking on them: additional information about the selected item is found in the sidebar.
Hovering your mouse over a node colors the connecting edges, highlighting the interaction of that node.
Individual nodes can be dragged to new positions on the graph. The entire graph can be panned, effectively changing the point of view.
The graph can be zoomed in and out by scrolling the mouse wheel. More details are shown at higher zoom levels. In particular, the badge used with several node types to convey impact information is enriched with the actual impact score.
Campaign sidebar
The sidebar is used to display information that is relative to one or more elements of the blueprint graph. By default it is minimized.
-
Click the icon to view node or edge information.
-
Click the icon to view third-party tools.
To minimize the sidebar, click the icon.
Node or edge information
The node/edge information tab provides additional information about a selected node or edge in the blueprint graph. To select a node, click on its icon in the graph.
|
Node type |
Information |
|---|---|
|
Analysis report |
Additional information about an analysis report. Report details:
Sightings details of the analyzed sample:
|
|
Malicious reputation entry |
Additional information about a malicious reputation entry (IP address or domain name). Entry details:
Malicious reputation history details
|
|
Downloaded file |
Additional information about a downloaded file File details:
Sightings details:
|
|
Email address |
Provides the email address. |
|
Email message |
Additional information about an email message Message details:
Analyzed URLs contained in the message:
Analyzed attachments contained in the message:
|
|
Host |
Additional information about a host. Host-level details:
Incidents involving the host:
A note indicates if the host is internal or external to the monitored network. |
|
Hostname |
Additional information about a domain name that was resolved.
|
|
HTTP request |
Additional information about an HTTP request. URL details:
Request details
|
|
Threat |
Additional information about a threat Threat details:
|
When you click an edge, the following information is displayed about the connection:
-
Source node — The source of the connection. This can be a node name, an IP address, a domain name, etc.
-
Target node — The destination of the connection. This can be a node name, an IP address, a domain name, etc.
Under the Source node and Target node is the actual source or target of the connection. Click the to expand the source or target.
Third-party tools
The third-party tools tab links to external tools that may provide additional information about an entity selected in the graph. Currently, the tools supported are DomainTools and VirusTotal.
The following searches are supported:
-
Selecting a host node allows you to search for the corresponding IP address on DomainTools and VirusTotal.
-
Selecting a hostname node allows you to search for the corresponding domain name on DomainTools and VirusTotal.
-
Selecting a downloaded file node allows to search for the corresponding hash on VirusTotal.
-
Selecting an HTTP request node allows to search for the request's hostname on DomainTools and VirusTotal.
Campaign hosts
The campaign Hosts tab displays a list of hosts that have been affected by the campaign:
-
Hosts — The IP address of the host affected by the campaign. Click the IP address link to view the Host summary sidebar.
For relevant entries, the value in this field may be Email.
-
Threats — A list of the detected threats.
-
Attack stages — The attack stages for the activity affecting that specific host that have been observed.
-
Latest activity — The time when activity was last detected for that host.
Campaign timeline
On the Threats timeline tab, detected threats are represented by threat cards. A threat card displays the calculated threat score, the threat name and class, the detection outcome (if available), the threat status, and other actions. The host which is connected to this threat is displayed. Expand the card to see its related evidence.
Sort the threat cards with the pull-down menu. Select from Most recent (the default), Earliest, Highest impact, and Lowest impact.
The quick search field above the list provides fast, as-you-type search. It filters the rows in the list, displaying only those rows that have text, in any field, that matches the query string. Your query is matched against values across the following categories: impact, IP address, threat/malware, latest campaign phase, first seen, evidence, other hosts, and, for mail messages, message information.
Toggle the Show closed threats button to filter the displayed threat cards by threat status. The default is to show all threats.
Threat cards
The Threat cards show all the threats associated with the selected campaign and their corresponding threat levels.
Each card displays the calculated threat impact, the threat name, the threat class, and if available, the detection outcome. It also shows the status of the threat: Open or Closed.
Click the Next steps button and select an action from the pull-down menu. Select from Close to close the threat (Open to reopen a closed threat) or Manage alert to create an alert management rule from the threat.
Evidence summary: section contains an overview of the evidence and other data detected for the threat. Click the icon (or almost anywhere else in the card) to expand the evidence details.
Evidence details
The Evidence column displays the file downloads, signatures, and other categories along with a timestamp of when the evidence was seen.
The Network interactions & network IOCs column displays the IP address or domain name of external hosts. Click the link to expand the Network interaction sidebar. Click the icon to view the host in Intelligence.
The Supporting data column provides a link to the detected events, a link to the captured data, and a link to the threat details.
Detection outcomes
Threat detection event outcomes have four possible values, listed in order of severity:
-
Succeeded — The threat was verified to have reached its goal. This could be its check-in attempt to the C&C server completed and data was received from the malicious endpoint.
-
Failed — The threat failed to reach its goal. This could be caused by the C&C server being offline, the attacker made coding errors, etc.
-
Blocked — The threat was blocked by the VMware NSX Network Detection and Response or by a third party application.
If the event outcome is unknown, this field is not displayed.
Campaign history
The campaign History tab displays a descriptive textual history of the campaign. Each entry provides a Notice and a Description of the campaign phases recorded.
Campaign evidence
The Evidence tab displays a list of the evidence detected for the current campaign.
The quick search field above the list provides fast, as-you-type search. It filters the rows in the list, displaying only those rows that have text, in any field, that matches the query string.
Each row is a summary of the evidence for the campaign. Click the icon (or anywhere on an entry row) to expand the row to view the Signature evidence.
The evidence list includes the following fields:
- IP Address
-
The IP address of the host that is the source of the threat.
- First Seen
-
Timestamp showing the start time of campaign.
- Last Seen
-
Timestamp showing the most recent activity of the campaign.
- Threat
-
Name of the detected security risk.
- Threat class
-
Name of the detected security risk class.
- Impact
-
The impact value indicates the critical level of the detected threat and ranges from 1 to 100:
-
Threats that are 70 or above are considered to be critical.
-
Threats that are between 30 and 69 are considered to be medium-risk.
-
Threats that are between 1 and 30 are considered to be benign.
If the icon appears, it indicates the artifact has been blocked.
-
- Evidence
-
The derived value of the evidence for the campaign. See About evidence for further details.
- Subject
-
Additional information from the campaign. This may be an IP address or an HTTP response code, or some other data. If available, click to view the subject in Intelligence pages.
- Reference
-
Click the link to access the Network event details page. The link opens in a new browser tab.
- Incident ID
-
A permalink to a correlated incident. The link will open in a new browser tab.
Signature evidence
The Signature evidence is expanded within the evidence list. It displays the following fields:
-
Threat — Name of the detected security risk.
-
Threat class — Name of the detected security risk class.
-
Impact — The impact score of the campaign.
-
Detector — If present, displays the VMware NSX Network Detection and Response module that identified the threat. Click the link to view the Detector pop-up.
-
View network event — Click the link to access the Network event details page. The link opens in a new browser tab.
-
View Incident — A permalink to a correlated incident. The link will open in a new browser tab.
-
First seen — Timestamp showing the start time of campaign.
-
Last seen — Timestamp showing the most recent activity of the campaign.
-
Severity — An estimate of how critical the detected threat is. For example, a connection to a command and control server is typically considered high severity as the connection is potentially damaging.
-
Confidence — Indicates the probability that the detected individual threat is indeed malicious. As the system uses advanced heuristics to detect unknown threats, in some cases, the detected threat may have a lower confidence value if the volume of information available for that specific threat is limited.
Campaign incidents
The campaign Incidents tab displays a list of incidents that comprise the campaign. The incidents list shows the registered incidents with their corresponding threat levels.
Each row is a summary of an incident. Click the icon (or anywhere on an entry row) to access the incident details.
The list is sorted by Impact and includes the following fields:
- Host
-
The host affected by this incident. This column will display the IP address, host name, or label of the host, depending on the current Display settings pop-up.
Click the icon to view the Activity for host page, showing details about the host. Click the icon to view the Network analysis graph for the host.
Click the icon to sort the list by host.
- Sensor
-
The Sensor that detected the events making up this incident.
Click the icon to sort the list by sensor.
- Detection events
-
Number of events that comprise this incident. This is a link displaying an event count and the icon. Clicking this link loads the Network events page, filtered to show only events for this incident.
Click the icon to sort the list by events.
- Start
-
Start time of incident.
Click the icon to sort the list by start time.
- End
-
End time of incident.
Click the icon to sort the list by end time.
- Threat
-
Name of the detected security risk.
Click the icon to sort the list by threat.
- Threat class
-
Name of the detected security risk class.
Click the icon to sort the list by threat class.
- Impact
-
The impact value indicates the critical level of the detected threat and ranges from 1 to 100:
-
Threats that are 70 or above are considered to be critical.
-
Threats that are between 30 and 69 are considered to be medium-risk.
-
Threats that are between 1 and 30 are considered to be benign.
If the icon appears, it indicates the artifact has been blocked.
The list is sorted in decreasing order of impact (most critical incidents at the top). Click the icon to sort the list in increasing order (least incidents threats at the top), then click the icon to toggle back to the default.
-
Campaign mail
The campaign Mail tab displays a list of email messages containing malicious attachments that comprise the campaign.
The quick search field above the list provides fast, as-you-type search. It filters the rows in the list, displaying only those rows that have text, in any field, that matches the query string.
Use the Select pull-down menu for a fine-tuned selection. Its options allow you to select All visible messages or to Clear selection. You can also click the icon in the title row to select all visible messages.
The email list displays all messages detected by all of the sensors. Quarantine actions (release or delete) may take a few seconds to execute as the action needs to be dispatched and executed by the Sensor hosting the specific message. You can monitor progress by refreshing the view or by selecting a specific message.
The system provides feedback about the number of messages selected for the requested action.
Customize the number of rows to be displayed. The default is 20 entries. Use the and icons to navigate through multiple pages.
The columns to be displayed in the list can be customized by clicking the icon.
Each row is a summary of a message. Click the icon (or anywhere on an entry row) to access the details. To select a message row, click the icon.
The list is sorted by Timestamp and includes the following fields:
- Timestamp
-
Indicates when the message was received. The time is shown in the currently selected timezone.
The list is sorted by timestamp, by default in decreasing order (latest attachment at the top). Click the icon to sort the list in increasing order (oldest attachment at the top). Click the icon to toggle to the default.
- Sensor
-
Name of the sensor that detected the message.
- Sender
-
The email address of the sender of the message. This email address may be spoofed.
Click the icon to sort the list alphabetically by the sender.
- Recipient
-
The email address of the recipient of the message.
Click the icon to sort the list alphabetically by the recipient.
- Subject
-
The provided subject of the message.
Click the icon to sort the list alphabetically by the subject.
- Attachments
-
Lists the number of attachments found in the message. Click the button to view the Attachments page for details about the attachment.
- URLs
-
Lists the number of URLs found in the message. Click the button to view the URLs page for details about the URLs.
- Threat
-
Name of the detected threat in the attachment or URL.
Click the icon to sort the list by threat. Initially the list is sorted by decreasing order (most critical at the top).
- Threat class
-
Name of the detected threat class of the attachment or URL.
Click the icon to sort the list by threat class. Initially the list is sorted by decreasing order (most critical at the top).
- Antivirus class
-
A label defining the antivirus class of the downloaded file.
- Malware
-
A label defining the malware type of the downloaded file. If the label has a icon, you can click it for a pop-up description.
- Impact
-
The impact value indicates the critical level of the detected threat and ranges from 1 to 100:
-
Threats that are 70 or above are considered to be critical.
-
Threats that are between 30 and 69 are considered to be medium-risk.
-
Threats that are between 1 and 30 are considered to be benign.
If the icon appears, it indicates the artifact has been blocked.
Click the icon to sort the list by impact.
-
- State
-
Indicates the lifecycle status of the analysis of the message.
- Assignee
-
The username of the analyst currently working on the analysis of the message.